Archive | Uncategorized

Introducing SCOM Maintenance Mode Scheduler 2.1 : Faster, More Flexible, Azure-Ready!

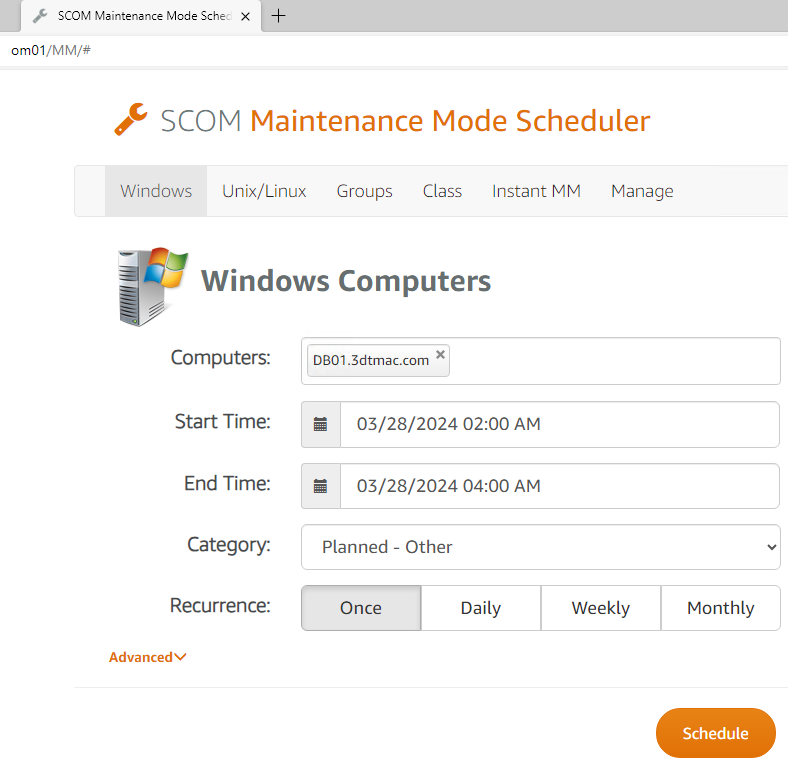
We’re excited to announce the release of SCOM Maintenance Mode Scheduler version 2.1, a significant update bringing powerful features and improvements to our users. This release includes enhanced support for Azure SCOM Managed Instances, performance optimizations, CSV import enhancements, and bug fixes, ensuring a smoother and more efficient maintenance scheduling experience.

Download
What’s New in 2.1?

  1. Azure SCOM Managed Instances Support – Expanding our horizon, version 2.1 introduces full support for Azure SCOM Managed Instances. This feature allows users to seamlessly integrate their Azure-managed environments with the SCOM Maintenance Mode Scheduler, providing a unified maintenance management solution across cloud and on-premises infrastructures. Now, managing maintenance windows for Azure SCOM Managed Instances is as effortless as for your on-premises servers.


  2. Speed Enhancements – We understand that time is of the essence. That’s why we’ve optimized our website to load faster, providing you with a swift and responsive experience. Whether you’re scheduling maintenance, viewing upcoming windows, or accessing reports, you’ll notice a significant improvement in performance.

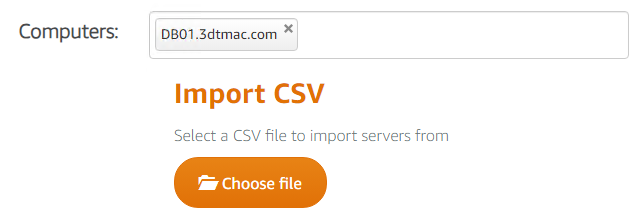
  3. CSV Import Improvements – Importing your server list has never been easier. With version 2.1, the CSV import functionality has been enhanced for greater flexibility. You no longer need to format your list strictly as a true CSV file. Now, you can import a straightforward list of computers, similar to the functionality available in the SCOM 2012 Maintenance Mode Scheduler. This improvement streamlines the process, saving you time and effort when managing large numbers of servers.
  4. Bug Fixes – We’re committed to providing a reliable and bug-free experience. In version 2.1, we’ve addressed several minor bugs, further stabilizing the application and enhancing its overall performance. These fixes are part of our ongoing effort to ensure the SCOM Maintenance Mode Scheduler meets your needs and exceeds your expectations.

Getting Started with 2.1

Upgrading to version 2.1 is straightforward and we strongly encourage all our users to update to take advantage of these new features and improvements. Visit our website for more details on the upgrade process and to download the latest version.

We’re excited to see how these new features will empower your maintenance management processes. As always, we value your feedback and are here to support you. Should you have any questions or need assistance, please don’t hesitate to reach out.

Thank you for choosing SCOM Maintenance Mode Scheduler. Here’s to making maintenance management smoother and more efficient than ever!
Continue Reading

Azure Maintenance Mode Scheduler

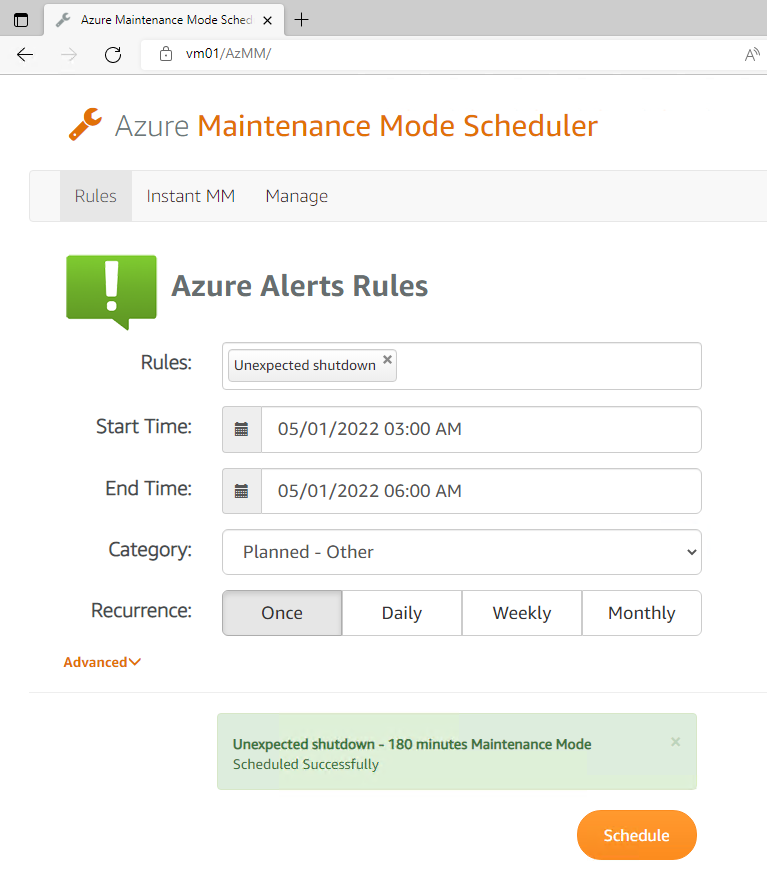
Azure Maintenance Mode Scheduler enables you to schedule maintenance windows for any Azure Alert. It also gives you the ability to immediately put an Alert into maintenance mode for an hour or a few days while you are working on an issue. Without the Azure Maintenance Mode Scheduler, often times engineers manually disable alerts and then forget to re-enable them or even worse they don’t disable them at all and the alerts become noise that gets ignored.

Features:

  • Easily access web based maintenance mode scheduler from any browser (Chrome, Edge, Safari and IE)
  • Schedule Azure Alerts for maintenance in a few seconds.
  • Import a CSV or text list of Alerts for scheduled maintenance.
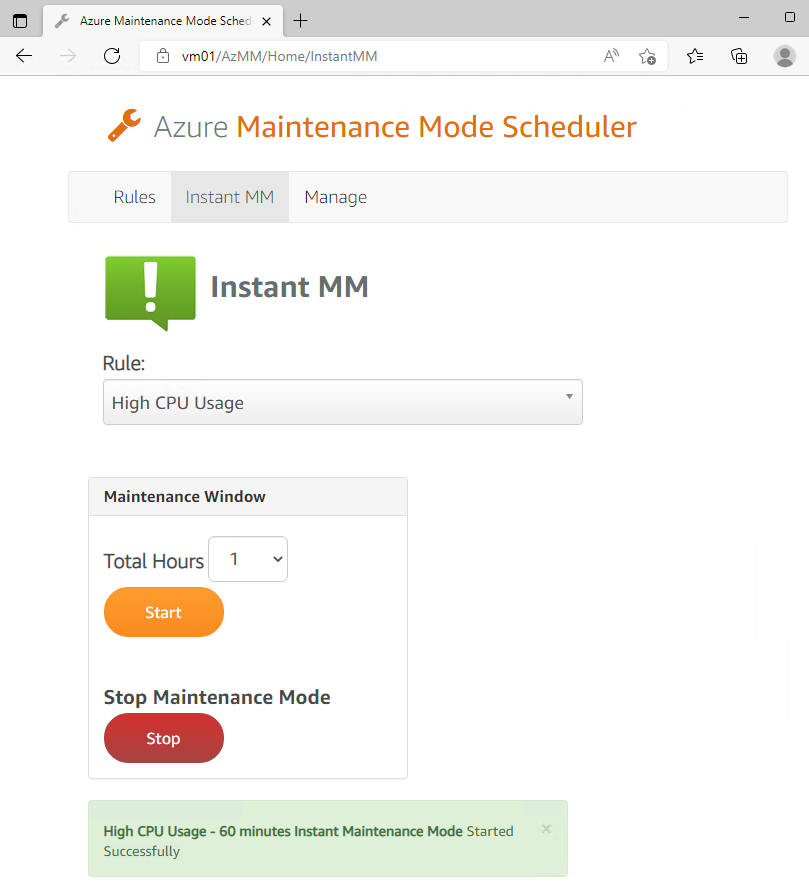
  • Instant MM: Server and application admins can instantly place Azure Alerts into maintenance before reboots and maintenance.
  • Instant MM can be called by a PowerShell or Unix Shell script from anywhere. This can be used to start and stop maintenance on any server for a specified amount of time. This makes it easy to integrate into your current change or software management process.
Download

Instant Maintenance Mode

This solution makes it easy for IT staff to put a server into maintenance mode without having to go to the Azure console. Anywhere on your network, the administrator can visit the Azure Maintenance Mode Scheduler Instant MM website at http://yourMMserver/Home/MM/InstantMM

Create a shortcut on the desktop of the servers to make it even easier.

Instant MM can be called by a PowerShell or Unix Shell script

Using URL Parameters, you can put Azure Alert rules into Maintenance Mode from any computer using a script. Typical use case would be using SCCM when updates or software is installed. SCCM would execute the PowerShell script before the install process to start maintenance mode. After the updates or software is installed SCCM would call the script to stop maintenance mode.

PowerShell Example Download: https://www.scom2k7.com/downloads/AzureMM.ps1.txt

param (
    [Parameter(Mandatory=$true)][string]$mmServer,
    [Parameter(Mandatory=$true)][string]$ruleName,
    [Parameter(Mandatory=$true)][string]$min,
    [Parameter(Mandatory=$true)][string]$action
 )

 $FullURL = "http://" + $mmServer + "/AzMM/Home/InstantMM?RuleName=" + $ruleName + "&Min=" + $min + "&MMAction=" + $action
 $FullURL

Invoke-RestMethod $FullURL -Method 'POST'

Unix/Linux Example Download: https://www.scom2k7.com/downloads/AzMM.sh

RuleName=$2
RuleName=$( printf "%s\n" "$RuleName" | sed 's/ /%20/g' )

url="http://$1/AzMM/Home/InstantMM?RuleName=$RuleName&Min=$3&MMAction=$4"

echo $url

wget $url --method POST 
Continue Reading

Monitoring a Hot Tub or Pool with Azure Monitor and Azure Log Analytics Part 5 – Tip and Tricks

Part 1 – Hardware and Software Setup || Part 2 – Azure Setup || Part 3 – Dashboarding and Workbooks || Part 4 – Alerting || Part 5 – Tips and Tricks

In Part 5, I have a couple tips and tricks.

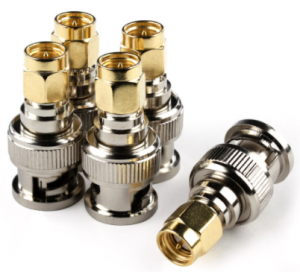
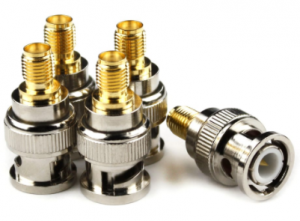
I don’t like the idea of having a plug near my Hot Tub so I purchased some of these connectors to go from SMC to BNC.

Link

Link

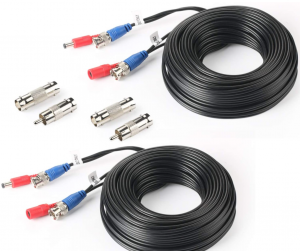
Then I ran 3 33ft standard BNC cables from my basement to my raspberry PI to the sensors in my hot tub.

After a while my ORP and PH sensors wore out after being submerged in water for over a year.

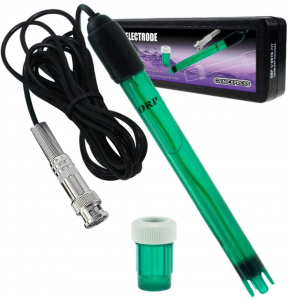
I purchased this cheaper ORP sensor that works better and last longer. Link

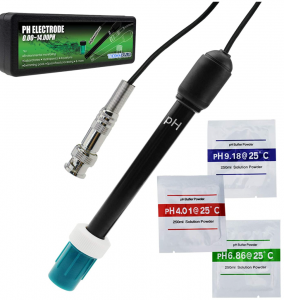
I also switch to this PH Sensor. Link

How to import the workbook into Azure.

Download the workbook from https://github.com/timmcfadden/HotTubMonitoring

Open up the HotTub.workbook in Notepad++ or VSCode

Copy out the JSON.

Create a new workbook in Azure Workbooks.

Click Advanced Editor

Leave it on Gallery Template and Paste in the JSON code and click Apply.

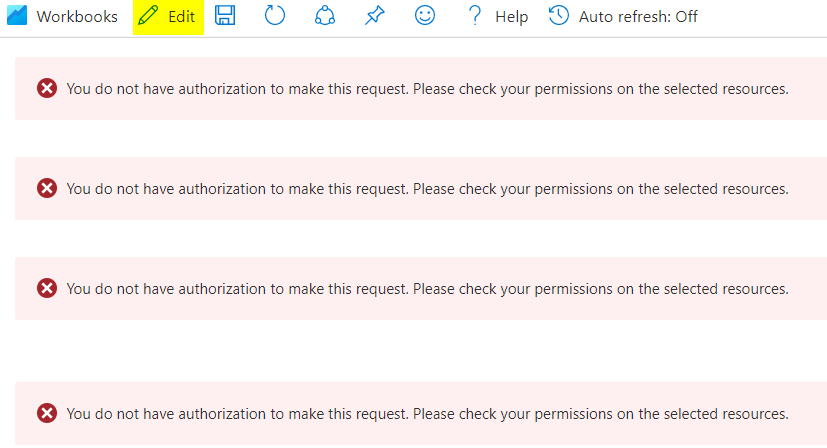
You will see a bunch of red X’s. We need to change to your Log Analytics workspace.

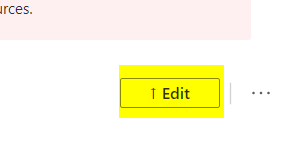
Click Edit

The click Edit

Then Click Edit again

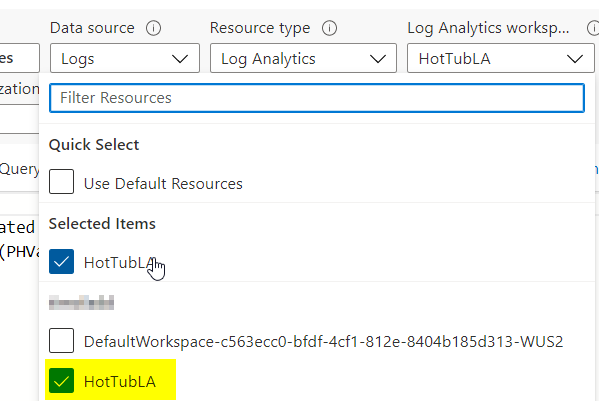
Now click Change

Under Log Analytics workspace. Select your log analytics workspace

Click Done Editing

Repeat the process for all of the Red X’s

When you are done all the data should be showing up

Continue Reading

Monitoring a Hot Tub or Pool with Azure Monitor and Azure Log Analytics Part 4 – Alerting

Part 1 – Hardware and Software Setup || Part 2 – Azure Setup || Part 3 – Dashboarding and Workbooks || Part 4 – Alerting || Part 5 – Tips and Tricks

In part 4 we are going to create e-mail alerts to tell us when the water has breached our desired thresholds for water quality.

We are going to setup rules to alert us when

PH is below 7.2 or PH is greater then 7.8More Information

ORP (Chlorine/Bromine Level) is below 650 or is greater than 750. More Information

Temperature is between 95 and 106 (This is for a HotTub)

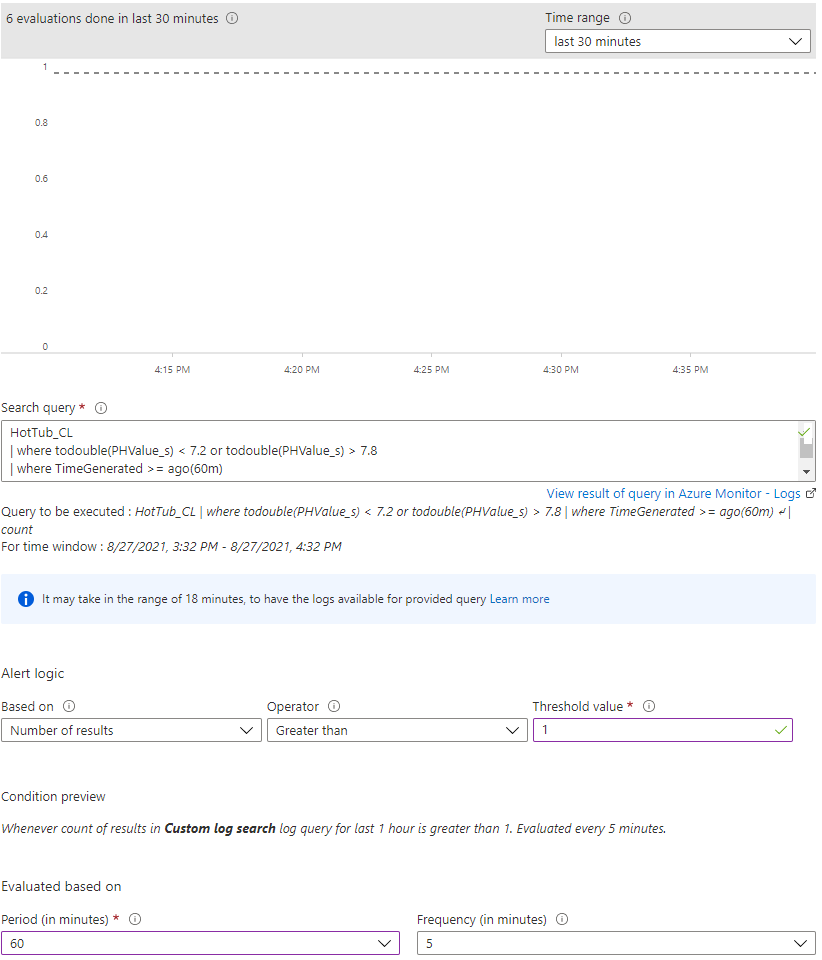
Open up Monitor, Logs. Type in the following query

HotTub_CL
| where todouble(PHValue_s) < 7.2 or todouble(PHValue_s) > 7.8
| where TimeGenerated >= ago(60m)

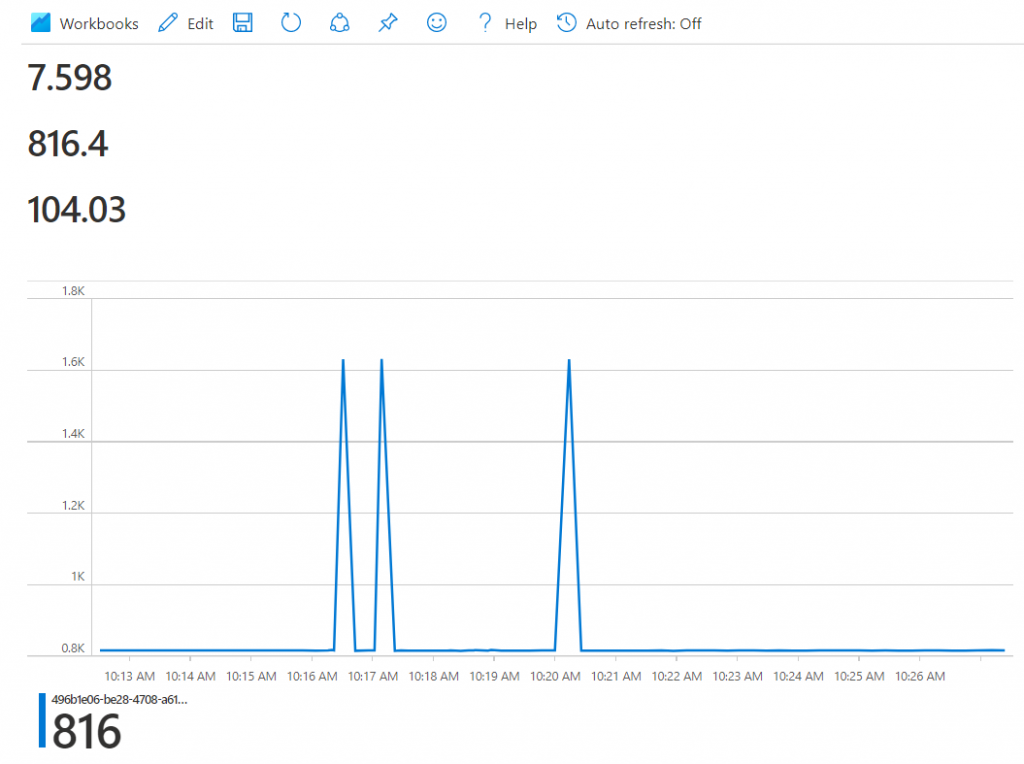
Set the Threshold value to 1 and the Period in minutes to 60. As you can see it won’t create any alerts right now as my current reading for the past 60 minutes has been around 7.6 which is within the range I want to be in.

Click Done, Under Actions select Add Action groups

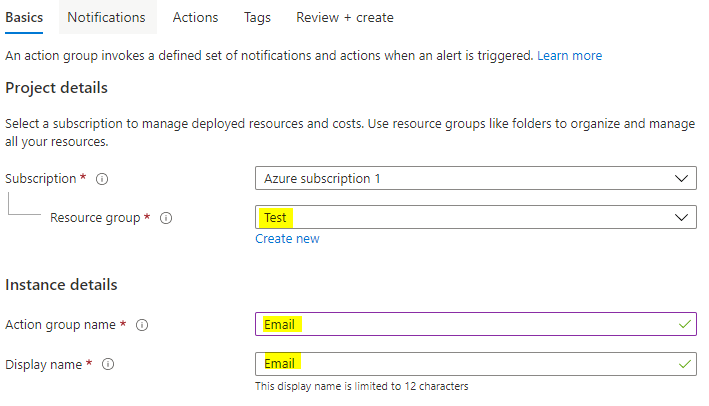
Click Create action group. Set Resource Group, Action group name and display name.

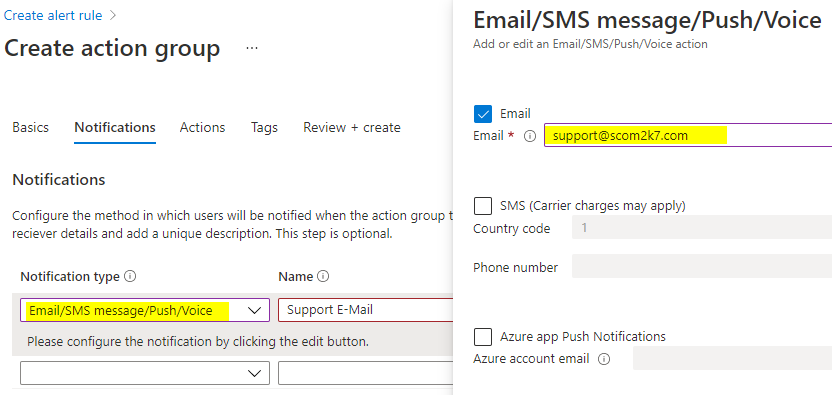
Set you notifications

Click Review + create and then Create

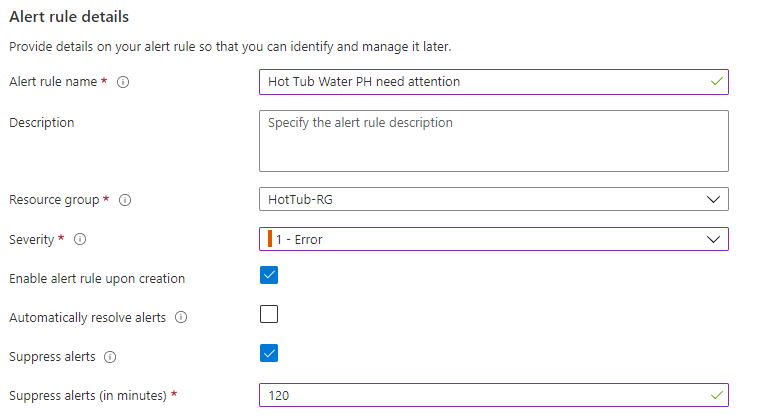
Set the following and click Create alert rule.

Repeat the process for ORP. (No need to create another action group. Reuse the existing one)

Here is the query.

HotTub_CL
| where todouble(ORPValue_s) < 650 or todouble(ORPValue_s) > 750
| where TimeGenerated >= ago(60m)

Repeat the Process for Temperature. Here is the query.

HotTub_CL
| where todouble(TempValue_s) < 95 or todouble(TempValue_s) > 106
| where TimeGenerated >= ago(60m)

Here are all my Alert Rules Setup

Now for some final tips and tricks

Monitoring a Hot Tub or Pool with Azure Monitor and Azure Log Analytics Part 5 – Tip and Tricks

Continue Reading

Monitoring a Hot Tub or Pool with Azure Monitor and Azure Log Analytics Part 3 – Dashboarding with Azure Monitor workbooks

Part 1 – Hardware and Software Setup || Part 2 – Azure Setup || Part 3 – Dashboarding and Workbooks || Part 4 – Alerting || Part 5 – Tips and Tricks

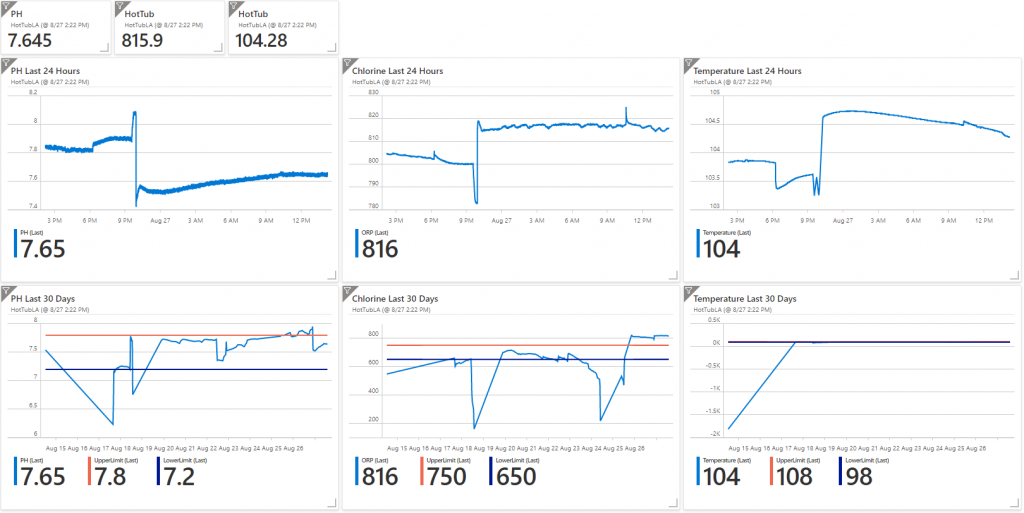
In part 3 we are going to build a dashboard like this to chart out history and progress of our water.

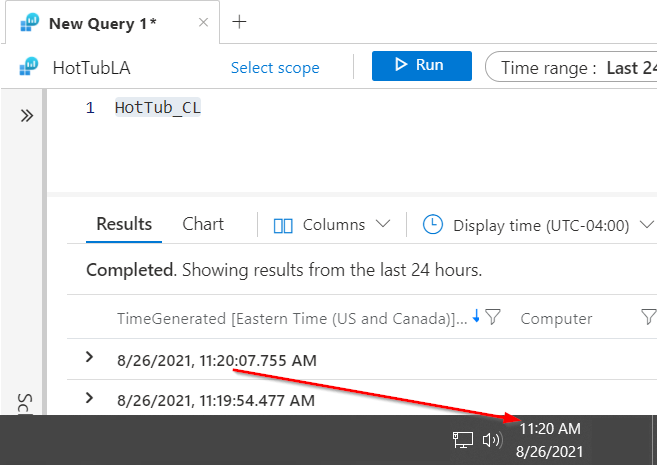
In Azure go to your Log Analytics workspace and verify the data is coming in. In Log Analytics query the HotTub_CL table and check the date time of the last entry and make sure its within a few minutes of the current data time .

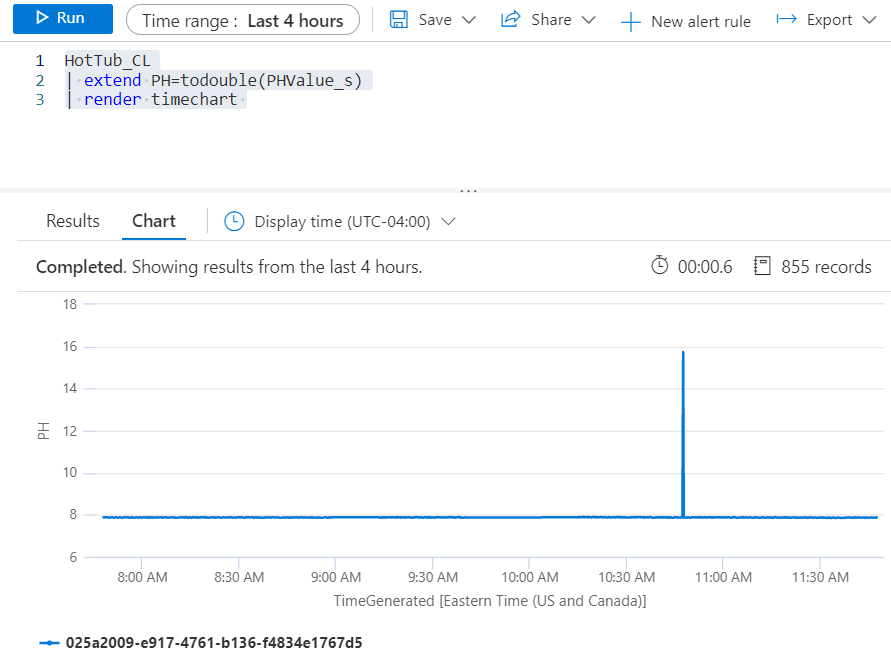
Now lets chart out the data. By default the data is coming in as a string data type. To chart the data we need to change it to a double. Type in the following command to chart out the PH data.

HotTub_CL
| extend PH=todouble(PHValue_s)
| render timechart

It should look like this.

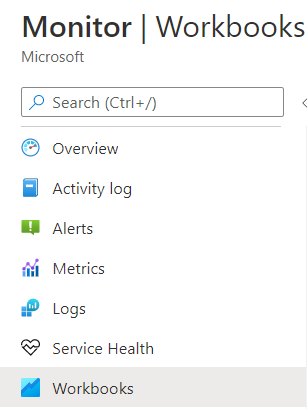
Now lets create some workbooks to show the data. Go to Monitor, Workbooks

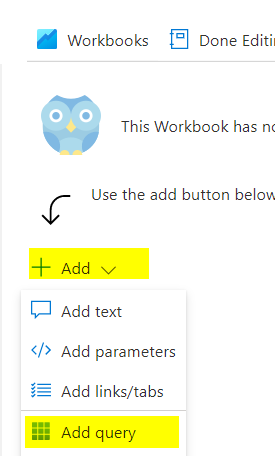
Click Add, Add query

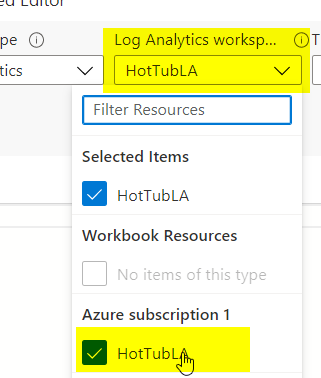
Select your log analytics workspace

Copy and Paste the Query

HotTub_CL
| extend PH=todouble(PHValue_s)
| render timechart

Change the Legend to Last Value and click Done Editing

Repeat the above process to create the ORP and Temperature Graphs. Here are their queries

ORP

HotTub_CL
| extend ORP=todouble(ORPValue_s)
| render timechart

Temperature

HotTub_CL
| extend Temperature=todouble(TempValue_s)
| render timechart

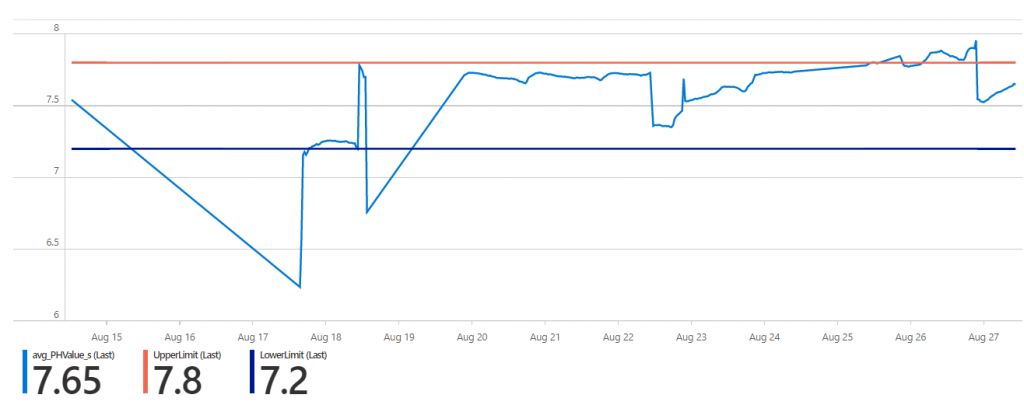
Now I would like to chart out the data over the last 30 days. I also want to set some visual thresholds. For PH anywhere between 7.2 and 7.8 is good.

Here is my query for PH for the last 30 days. This query uses the bin function to round the data to 30 minute intervals, if I tried to use all the data points for the last 30 days the chart wouldn’t render.

HotTub_CL
| where TimeGenerated > ago(30d)
| summarize avg(todouble(PHValue_s)) by bin(TimeGenerated , 30m)
| order by TimeGenerated desc
| extend UpperLimit = 7.8
| extend LowerLimit = 7.2
| render timechart

You can download the entire workbook and Import it into your Azure environment.

Link Click Code, Download Zip

**Note** See Part 5 – Tip and Tricks for how to import and configure the workbook to work in to your environment.

Now that we have all of the charts created lets add them to an Azure Dashboard.

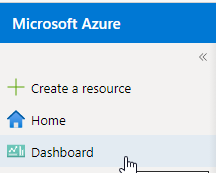
In the portal go to Dashboard.

Give the Dashboard a name like HotTub and click Save.

Now click Share

Then click Publish. This will make it easier to find later.

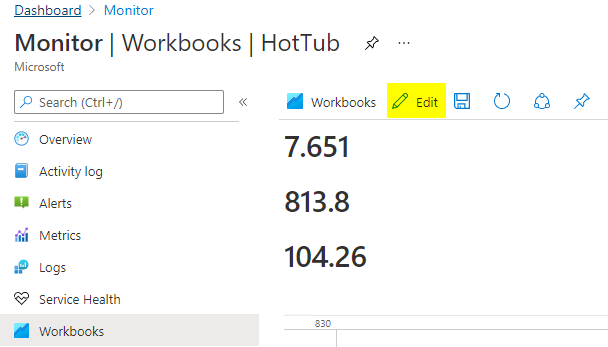
Go back to the HotTub workbook under Monitor, Workbooks. Click Edit

Now click the Pin and select Pin All. (**IMPORTANT** If you don’t click Edit first you won’t get the option to Pin All and your charts won’t show up correctly)

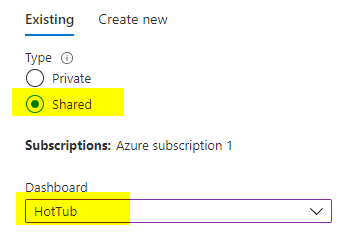
Select Shared and Select the HotTub Dashboard.

Click the Pinning succeeded to go to your dashboard

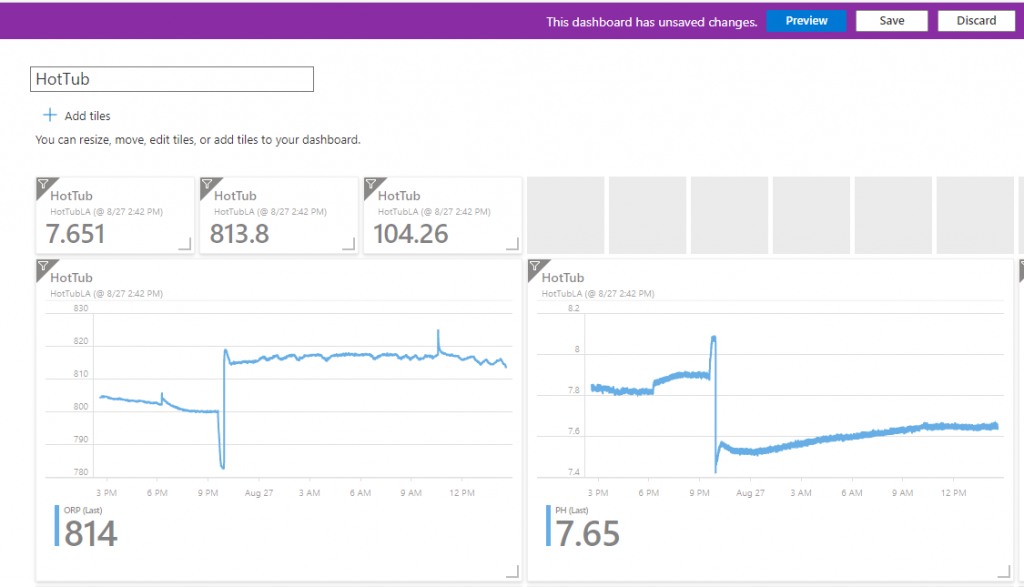
It will bring in all your charts and values. Now we have to clean up the dashboard so it looks nice. Click Edit and start resizing and moving tiles around

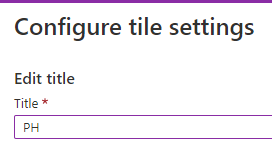
To change the headings. Click the … when you hover over a tile and click Configure tile settings

When you give it a name it will replace the HotTub name at the top of the tile.

Click Save when you are done. You should now have a complete dashboard.

Next lets setup some alerting so we don’t have to stare at the dashboards all day.

Monitoring a Hot Tub or Pool with Azure Monitor and Azure Log Analytics Part 4 – Alerting

Continue Reading

Monitoring a Hot Tub or Pool with Azure Monitor and Azure Log Analytics – Part 2 – Azure Setup

Part 1 – Hardware and Software Setup || Part 2 – Azure Setup || Part 3 – Dashboarding and Workbooks || Part 4 – Alerting || Part 5 – Tips and Tricks

In Part 2, we are going to hookup the hot tub / pool sensors into Azure using Azure Monitor and Log Analytics

Create a Log Analytics Workspace in Azure.

If you don’t already have a MSDN account you can create a free trial account with a $200 credit at https://azure.microsoft.com/en-us/free

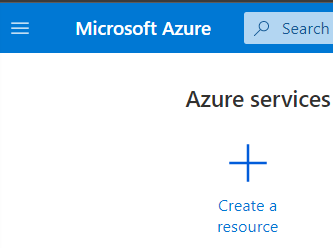
Once you have an Azure account go to http://portal.azure.com and click Create a resource

Search for “Log Analytics Workspace

Click Create

Under Create Log Analytics workspace. Type in the following

Resource group: HotTub-RG

Name: HotTubLA

Under Pricing tier leave the default Pay-as-you-go (Per GB 2018)

Click Review + Create and then click Create.

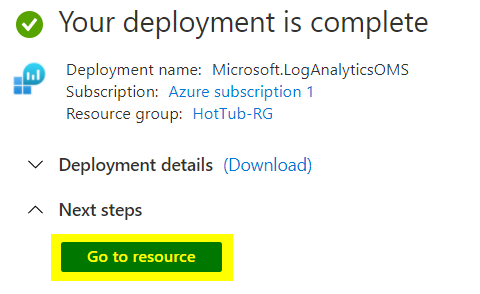
Once Deployment is Complete. Select Go to resource

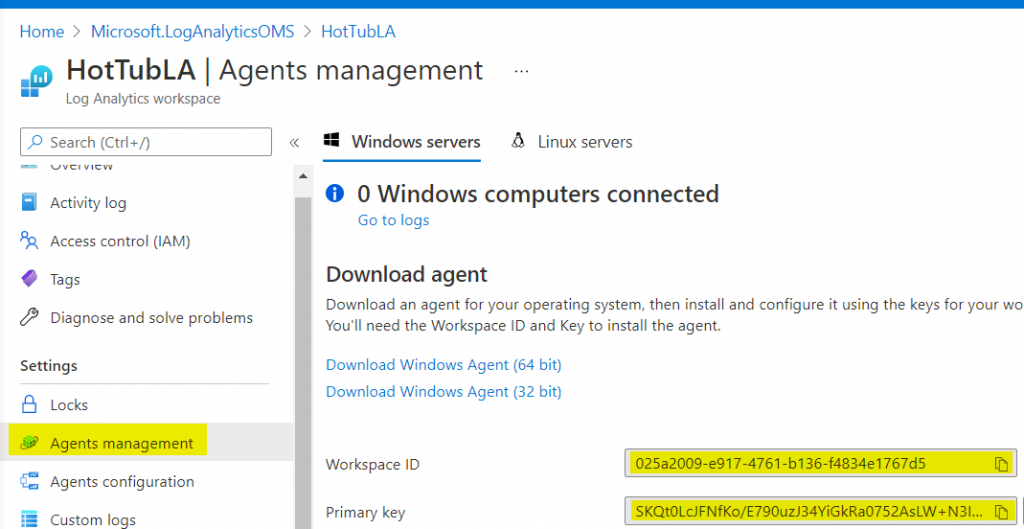
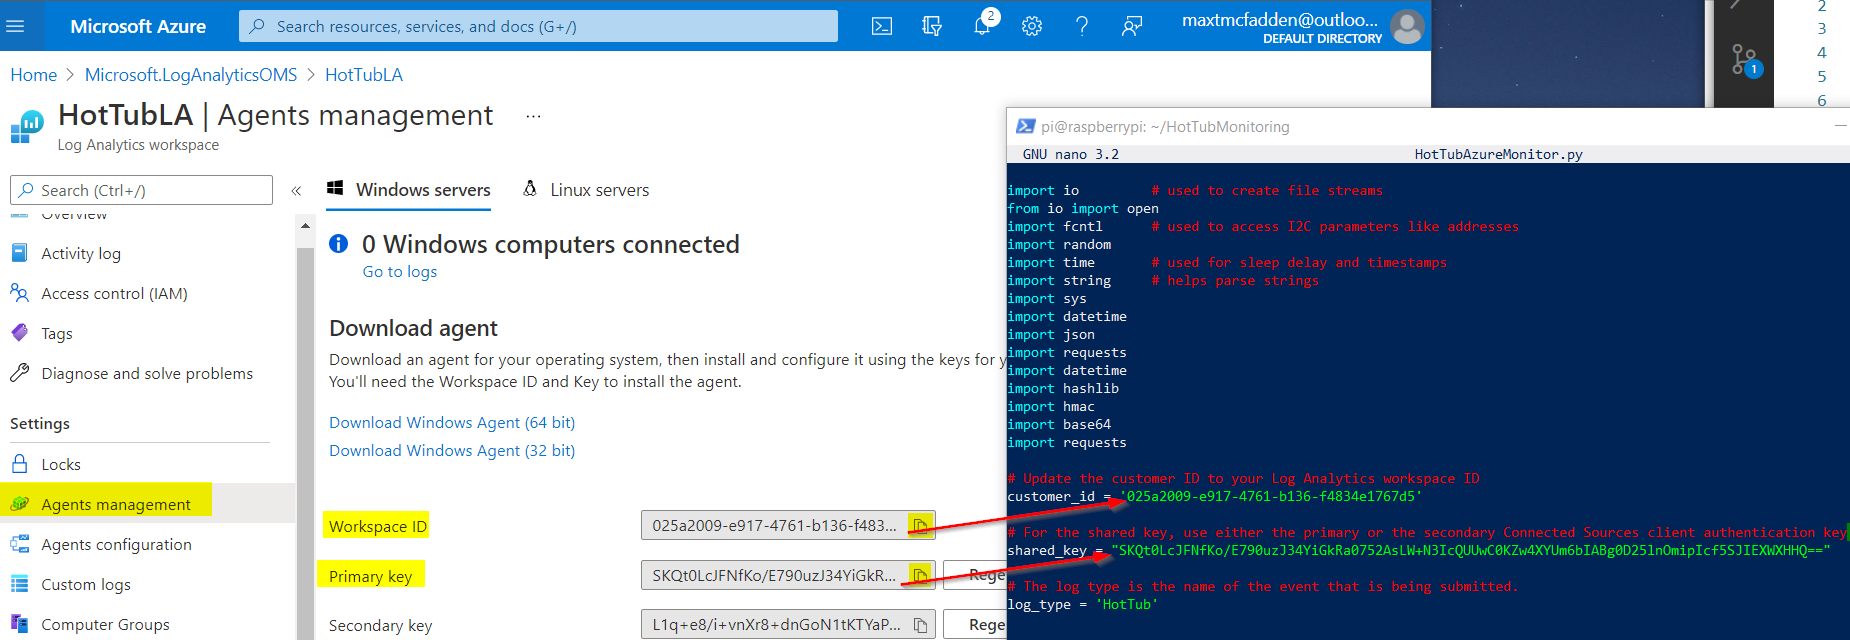
In the Log Analytics workspace we need the Workspace ID and Primary Key. Click Agents management. Copy this information to notepad for use later.

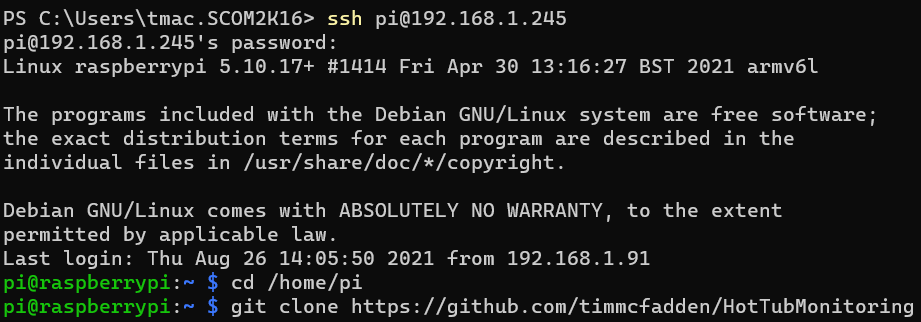
Log into your Raspberry PI device with Powershell and SSh.

Go to home directory

cd /home/pi

Type in this command to install the git repository

git clone https://github.com/timmcfadden/HotTubMonitoring

change directory to HotTubMonitoring

cd HotTubMonitoring

open up HotTubAzureMonitor.py in nano

sudo nano HotTubAzureMonitor.py

Copy and paste your Workspace ID from Azure to the customer_id. Copy and paste your Primary key to shared_key

Control-x to Exit

Y to Save modified buffer and click enter

Now lets test the python code. Type in:

python3 /home/pi/HotTubMonitoring/HotTubAzureMonitor.py

If everything is setup correctly you should see the values from the sensors and Accepted

It can take 5-10 minutes for the data to initially show up in Log Analytics.

Go back to Azure and your Log Analytics workspace an verify the data is making it to Azure.

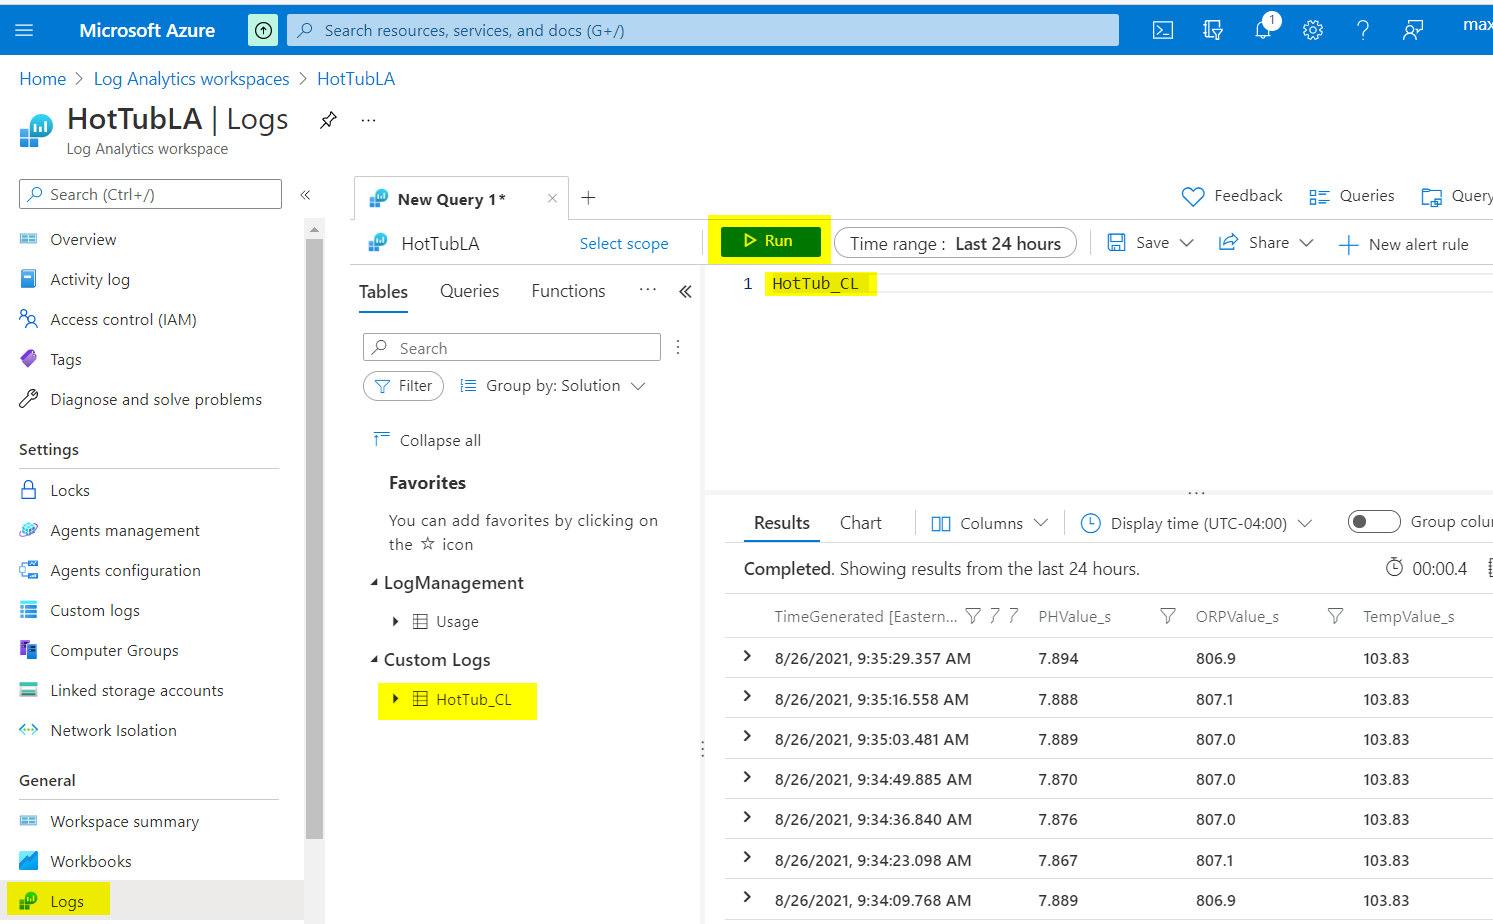
Click on Logs, Expand Custom Logs, and Double click on HotTub_CL and click Run

As you can see we have the data flowing in to Log Analytics.

Now lets setup our Raspberry Pi to run the Python code at startup and run it as a background task so it runs all the time.

Control + C to exit out of the running python code.

Type in

sudo nano /etc/rc.local

Add the following text to the beginning of the rc.local file.

python3 /home/pi/HotTubMonitoring/HotTubAzureMonitor.py &

It should look like this.

Exit out Control + x and Y and Enter to save

Now Reboot the Raspberry Pi

sudo reboot

After it reboots log back into the Raspberry Pi

Now type in

ps -ef

You should see the process in the list that looks like this. This process will run in a loop collecting data. If it ever stops for whatever reason you can simply reboot the device (even just pull the power) and it will start back up at startup.

exit out of the raspberry pi by typing

exit

Now lets setup some Dashboards in Azure so we can see the data anytime.

Monitoring a Hot Tub or Pool with Azure Monitor and Azure Log Analytics Part 3 – Dashboarding with Azure Monitor workbooks

Continue Reading