
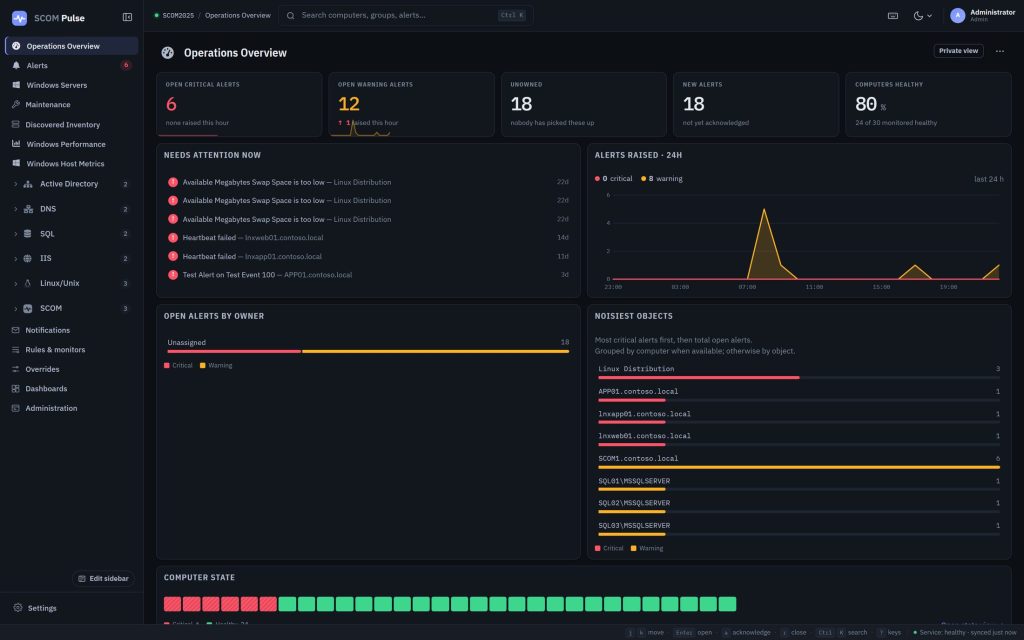
Introducing SCOM Pulse: see more, understand more, do more with SCOM
SCOM already knows a lot about your environment. Getting a clear picture of that information, and acting on it, should be easier.
SCOM Pulse brings dashboards, alert investigation, performance history, maintenance planning and management group administration together in a browser. See how your services are performing, find out exactly what SCOM is configured to monitor on a server, and look inside the operational database and data warehouse to understand where the space is going.
It connects to the management group you already run, uses your existing SCOM user roles, and works alongside the Operations console. We have been building tools for Operations Manager since 2007, and this is the biggest thing we have shipped.
Version 1.3.0 is available now. Download the 30-day trial: no licence key or sales call required.
Download the 30-day trialDashboards that put the details in context
A useful dashboard should help you decide where to look next.
Pulse brings health, alerts, inventory and performance together. On the DNS dashboard you can see server and zone health alongside query rates, responses, recursion failures and forwarder health. On the IIS dashboard you can see websites, application pools, requests and connections together, with stopped sites and pools listed first.
That gives you context: which service is affected, how it is behaving, and which objects need attention. Build your own dashboards, organise them into folders, and share read-only links with people who need visibility into the environment.

See what SCOM is actually configured to monitor
“What are we monitoring on this server?” should be a straightforward question to answer.
The Effective configuration view brings together the rules and monitors that apply to an object, with the option to include its contained objects. See which workflows are disabled, which generate alerts, and which have been changed by overrides, with the default and the value in effect side by side. Search the configuration, filter it, or export it to CSV for review.
That makes it useful when investigating missing alerts, reviewing monitoring coverage, or checking what your tuning has changed. You can examine the configuration that applies to a server and its workloads in one place.

Understand what is happening inside SCOM itself
SCOM administrators also need visibility into the platform doing the monitoring.
Pulse includes dedicated views for the operational database and the data warehouse. The warehouse view shows where the space is being used, retention by dataset and aggregation, when grooming last ran, the age of the oldest data, rows waiting in staging and any aggregations that have fallen behind. The operational database view does the same for the live database: how full its files are, which kinds of record fill its tables, and the grooming retention for each.
You can see whether events account for most of the warehouse, review retention setting by setting, and spot signs that processing or grooming needs attention.

Plan maintenance on a calendar
See maintenance in the context of the day, week or month. Pulse shows active maintenance, upcoming occurrences and recent history, with calendar and agenda views alongside the table. Review planned windows, see where schedules overlap, and start immediate maintenance or schedule a future window from the same page.
Pulse uses SCOM’s own maintenance schedules, so the Operations console sees the schedules you create.
Move from an alert to an informed action
Open an alert to see why it fired, the management pack knowledge and the related open alerts. The inline Health Explorer opens on the unhealthy path and follows dependencies into related objects, so you reach the object that is actually unhealthy.
From there, acknowledge or assign the alert, add a comment, run a task, put the object into maintenance or create an override, without leaving the page.

Performance views add the longer-term picture, with live counters and 30-day, 90-day and 1-year ranges from the data warehouse when it is enabled.
Keep the everyday administration close at hand
Discover computers and deploy Windows agents with progress for each computer, then repair, uninstall, reassign or approve agents.
Manage rules, monitors, overrides, management packs, groups, Run As, user roles and notifications, with an audit trail of changes made through Pulse.
The experience is built for moving between an overview, an individual server, its monitoring configuration and the action you need to take.
What it takes to run
Pulse goes on one Windows server, a dedicated server or a management server; a dedicated server does not need the Operations console. One installer wizard installs and configures it, then opens the site.
- Operations Manager 2016 UR7 and later, 2019, 2022 and 2025
- Windows Server 2016 or later, and .NET Framework 4.6.2 or later — in-box on every supported version
- IIS with ASP.NET 4.x and Windows Authentication; setup installs the features if they are missing
- A domain service account; setup suggests the SCOM Data Access Service account by default
There is no additional software on monitored computers, no separate database server, and nothing changes about how your agents report.
The application makes no calls to the internet: no CDN, no external fonts, no telemetry. It is built to run on a network with no outbound path at all. The installer is Authenticode signed and timestamped, and a sealed management pack ships with the product so SCOM can monitor Pulse itself — we do not import it for you, because importing changes your management group.
Sign-in and access
Pulse uses Windows Authentication, so there is no Pulse password to type or store, and your existing SCOM user roles. People see the objects their roles cover and can perform the actions those roles allow. There is no separate Pulse permission model to maintain.
Signing in on its own grants nothing: someone in no SCOM user role sees nothing, and is told why. To give someone access, add them to a SCOM user role. What each role can do is on the product page.
Where this leaves the Maintenance Mode Scheduler
Exactly where it was, with one addition: it now comes with Pulse. A SCOM Pulse licence includes the SCOM Maintenance Mode Scheduler at no extra charge for as long as Pulse is active. If you already have a Scheduler subscription and move to Pulse, the unused portion is credited against your Pulse licence. If scheduling windows is your whole requirement, the Scheduler is still sold on its own and still costs less. If your team lives in the Operations console all day, Pulse replaces more of that day, and the Scheduler comes along.
Pricing and the trial
One licence covers the whole management group, with unlimited users and no named-user seats. Pulse is priced by the number of agents in your management group and billed annually, in US dollars.
- Up to 500 agents — $5,000 a year (about $417 a month)
- Up to 1,500 agents — $8,500 a year (about $708 a month)
- Up to 4,000 agents — $12,000 a year (about $1,000 a month)
- Above 4,000 agents — from $20,000 a year, by quote
A 3-year subscription paid up front carries a 10% discount and holds the price for the term. The first three tiers can be bought straight from the pricing page.
You do not need any of that to try it. Download the package, install it, and leave the licence key blank — a 30-day trial starts on its own.
Download the 30-day trial See the full product page →Try Pulse against your own management group. Explore your dashboards, inspect a server’s effective configuration, and see what is happening inside your data warehouse. Then tell us what you think: write to [email protected], or use the contact form.