Part 1 – Hardware and Software Setup || Part 2 – Azure Setup || Part 3 – Dashboarding and Workbooks || Part 4 – Alerting || Part 5 – Tips and Tricks
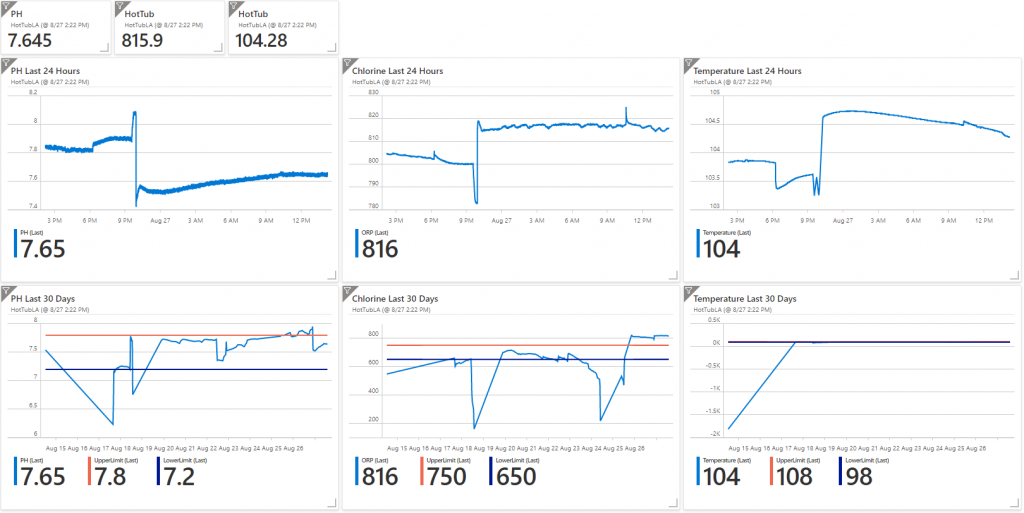
Are you having trouble keeping your Hot Tub or Pool water balanced? Are you wasting time checking to see if their is enough chlorine/bromine in your hot tub or pool everyday? Do you want to know the temperature of your pool or hot tub anytime of the day from your phone?
With Azure Log Analytics, a Raspberry PI Zero and some IOT parts you can built an awesome Hot Tub or Pool Monitoring Solution.
Here is the equipment you need:
Raspberry Pi Zero WH (Zero W with Headers) – $14
microSD Memory Card– $7.50
5V 2.5A Power Supply – $7.50
Wifi Pool Kit – $349.99
Jumper Wires – $7.49
Azure Subscription
Hardware
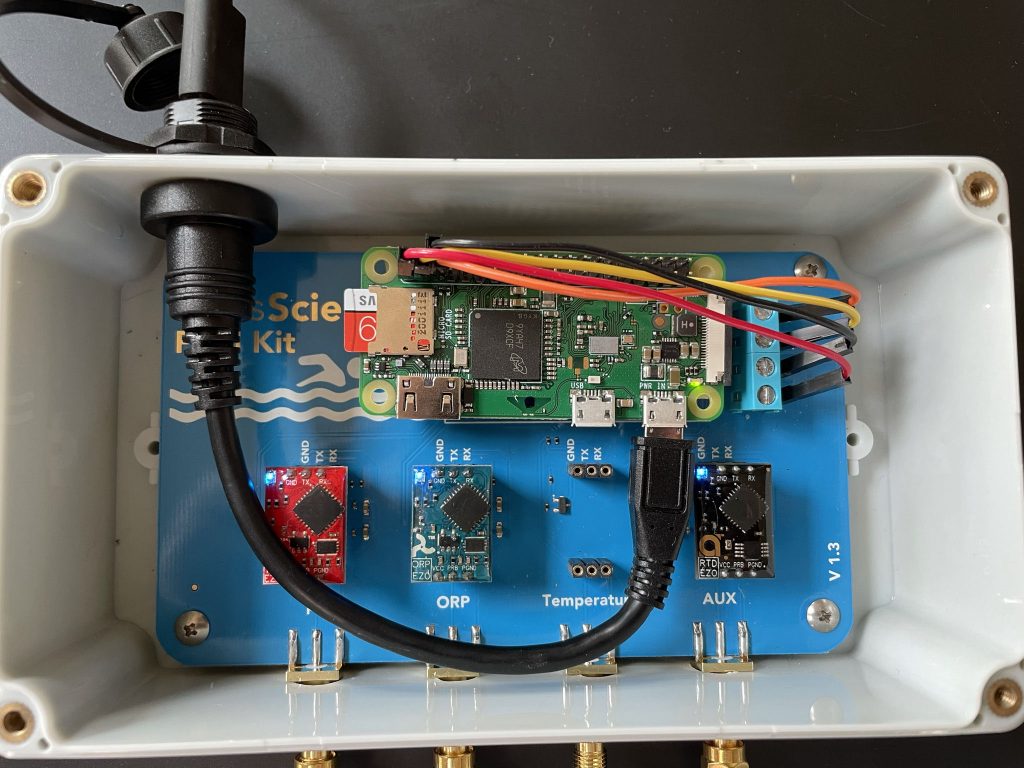
Remove the Arduino board that comes with the Wifi Pool Kit. Attach the micro USB cable to the power port of the Raspberry PI. Attach each of the jumper cables as specified in the drawing. To attach them to the blue board you will first have to loosen the small screws then attach the jumper cable and tighten the screws.
Move the Temperature Chip from the Temperature Slot to the AUX slot. It doesn’t work correctly in the Temperature slot with Raspberry PI
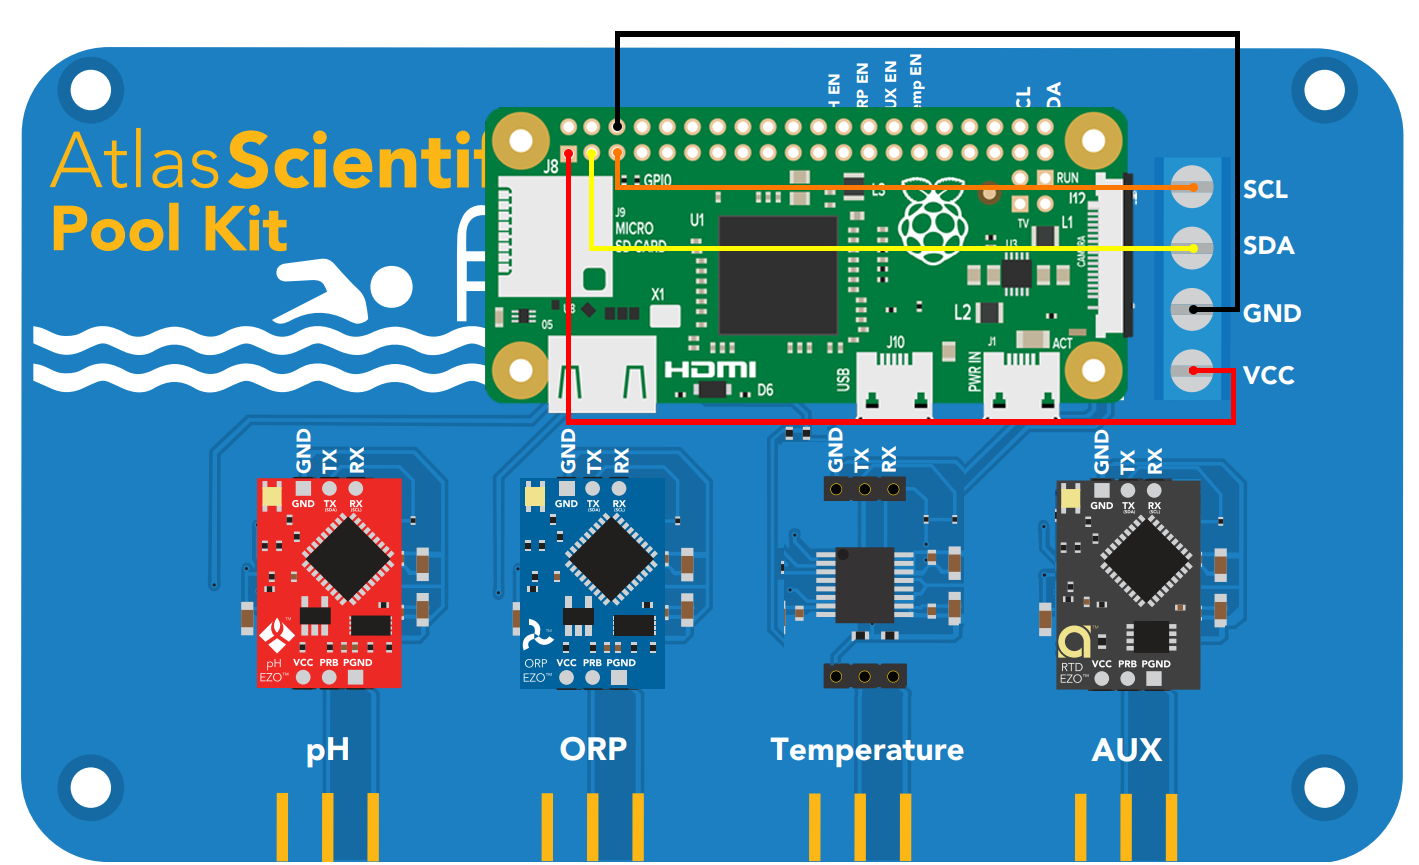
Screw in the PH, ORP and Temperature sensors into their respective ports.
When you plug it in the lights should light up blue if everything is working correctly
Software
First we need to get the Raspberry Pi Zero installed and communicating on your WiFi with SSH.
- Plug in the microSD Memory card in your computer. (If you don’t have a slot in your computer you will need a microsSD usb reader or another computer that has one)
- Download the Raspberry PI Imager Link
- Run the Raspberry PI Imager.
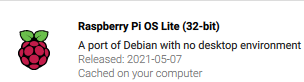
- For Operating System choose Raspberry Pi OS (other)
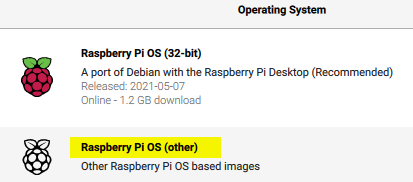
- Then choose Raspberry Pi OS Lite (32-bit)
- Choose your MicroSD card for Storage and Click Write
- REMOVE AND REINSERT THE MICROSD CARD – This step is only necessary because Raspberry PI Imager automatically unmounts the SD card.
Before we put the microSD card into the Pi, we’ll need to edit some files.
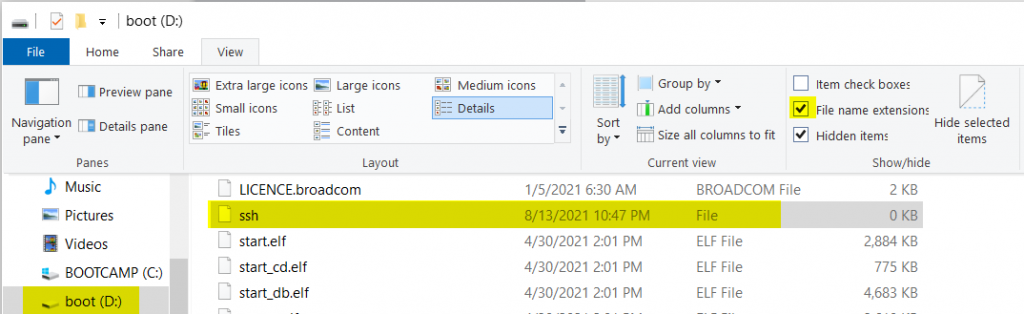
- In the root of the microSD drive, create a file called ssh (make sure there is no file extension). This file will enable SSH on the Pi. You can create a empty txt file called ssh.txt and remove the txt extension. You might need to click view and select File Name Extensions to remove the file extension.
Create a file called wpa_supplicant.conf and copy the code below changing the ssid and psk to your wifi name and password. Save this file to the root of the microSD drive as well. This is a configuration file that will allow you to pre-configure the WiFi credentials. On boot, the Pi will copy and use this as the default configuration file.
country=US
ctrl_interface=DIR=/var/run/wpa_supplicant GROUP=netdev
update_config=1

network={
ssid="YOUR_WIFI_SSID"
scan_ssid=1
psk="YOUR_WIFI_PASSWORD"
key_mgmt=WPA-PSK
}
Please double check and verify the WiFi credentials. If not, the next step will be hard.
Remove the MicroSD card from your computer and place it in the RaspberryPI Zero.
We need the IP address of the Raspberry Pi. To find out the IP address you can either log into your router and look for a computer connected to your network called raspberrypi. You an also use a IP scanning tool like Advanced IP Scanner
Now that we have the IP address we can SSH into the Raspberry PI. The default login is
UserName: pi
Password: raspberry
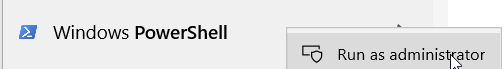
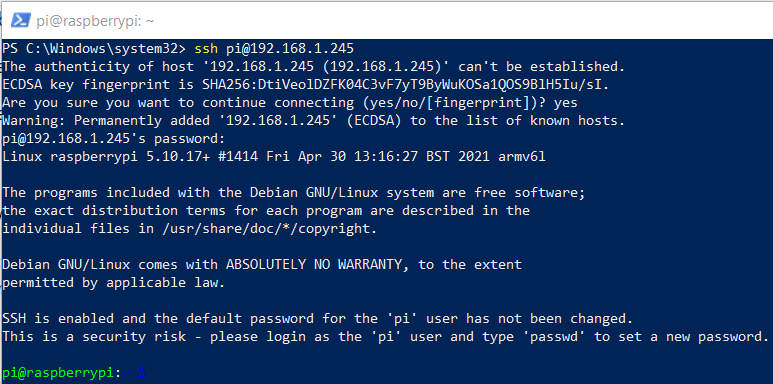
To login to the device using windows 10 open up Windows PowerShell (Right Click Run as administrator)
Type in ssh pi@yourIpAddress
Run the following command in the terminal.
sudo apt-get install python-smbus
sudo apt-get install i2c-tools
Once those have finished installing run
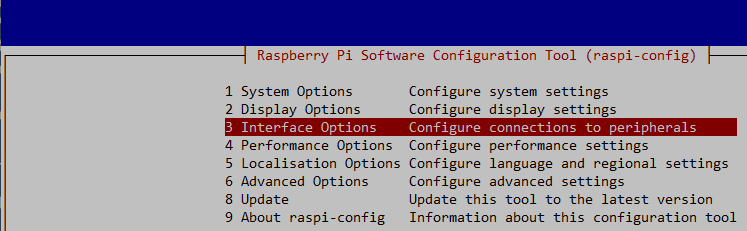
sudo raspi-config
You should see a blue screen with a grey box with options. Select 3 Interface Options. Click Enter
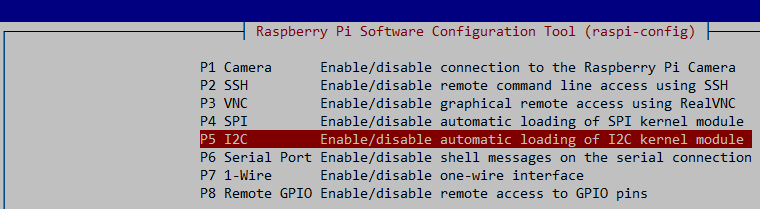
Next choose P5 I2C Enable/disable automatic loading of I2C kernel module. Click Enter
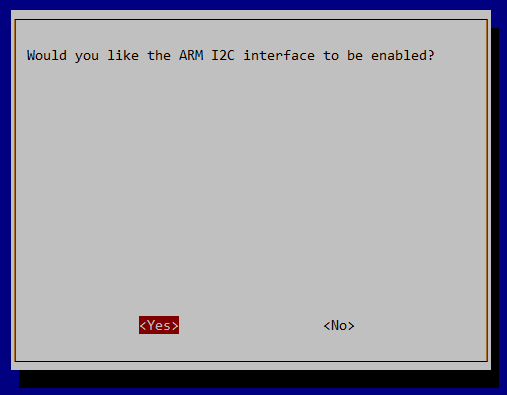
Choose Yes. Click Enter
Click Ok on the next screen then go down to the bottom of the screen and click Finish.
Reboot the Raspberry Pi
sudo reboot
Now with the raspberry pi is setup to communicate with the sensors lets test it out.
Log back into the raspberry pi with SSH using PowerShell.
Install git
sudo apt-get install git

Download the sample code
git clone https://github.com/AtlasScientific/Raspberry-Pi-sample-code.git

CD into the Raspberry-Pi-sample-code directory

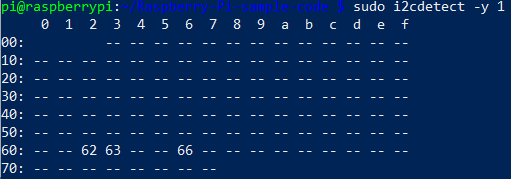
Run the following code to make sure your devices are showing up. If you don’t see them then check the connection to the Raspberry PI and the Blue Board.
sudo i2cdetect -y 1
Run the following command to bring up a test command interface
sudo python i2c.py
Then in the enter the following command. This will start polling all three interfaces.
Poll,2.0
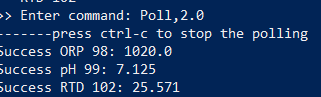
Control-c to exit the polling and Control-c to exit the script.
Now lets hook it up to Azure Monitor and Log Analytics.
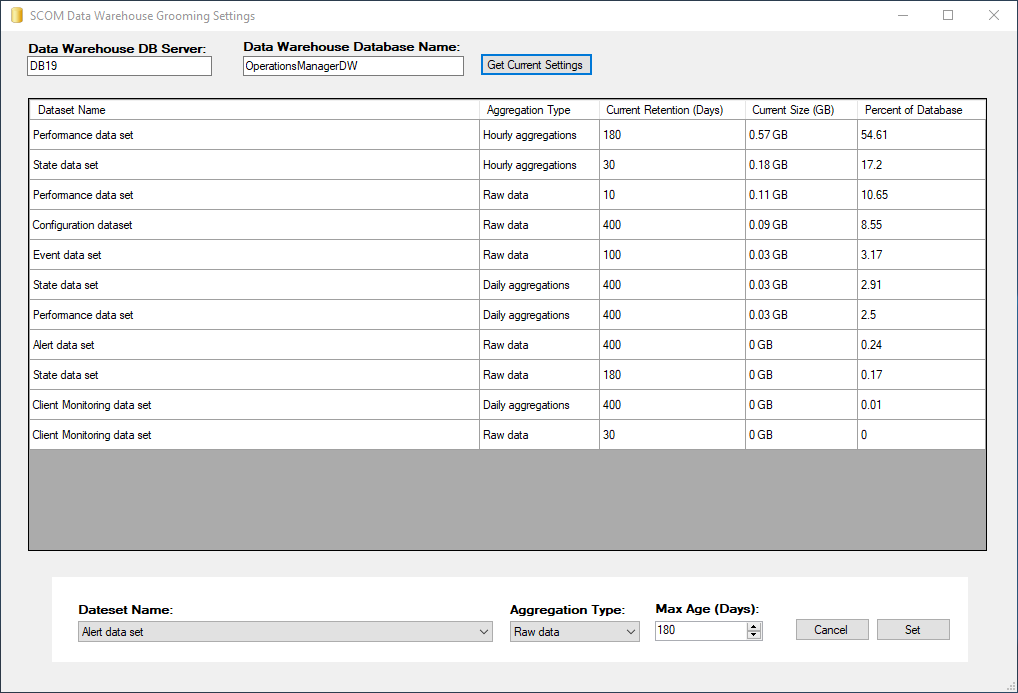
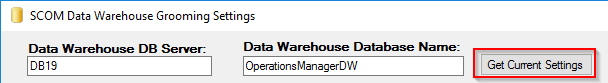
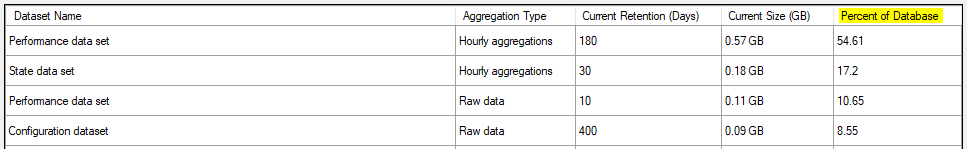
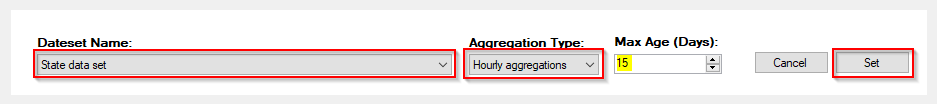
Monitoring a Hot Tub or Pool with Azure Monitor and Azure Log Analytics – Part 2 – Azure Setup


