We’re excited to announce the release of SCOM Maintenance Mode Scheduler version 2.1, a significant update bringing powerful features and improvements to our users. This release includes enhanced support for Azure SCOM Managed Instances, performance optimizations, CSV import enhancements, and bug fixes, ensuring a smoother and more efficient maintenance scheduling experience.
Download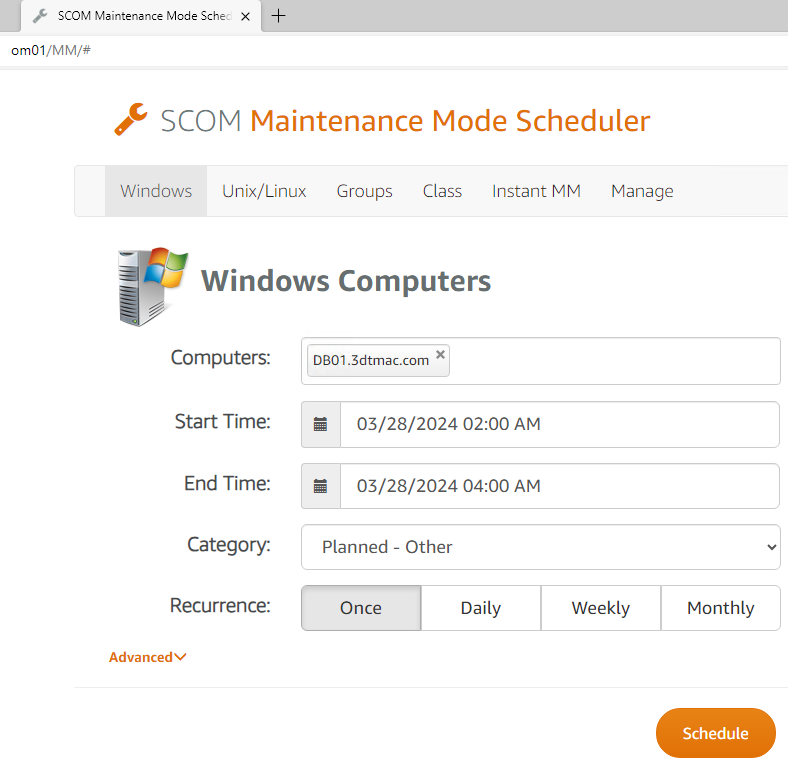
What’s New in 2.1?
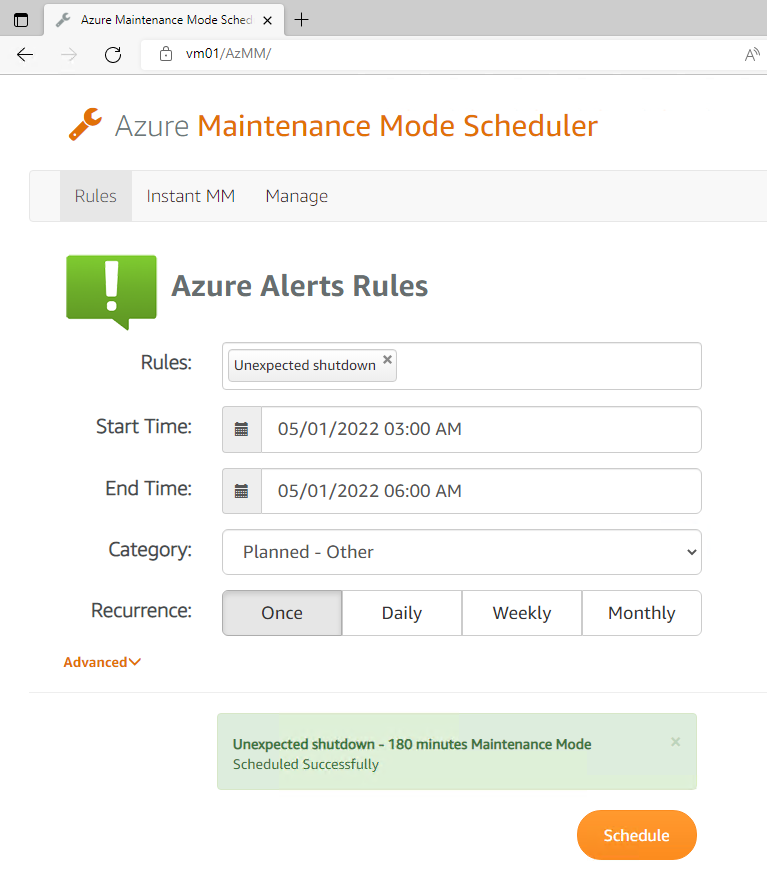
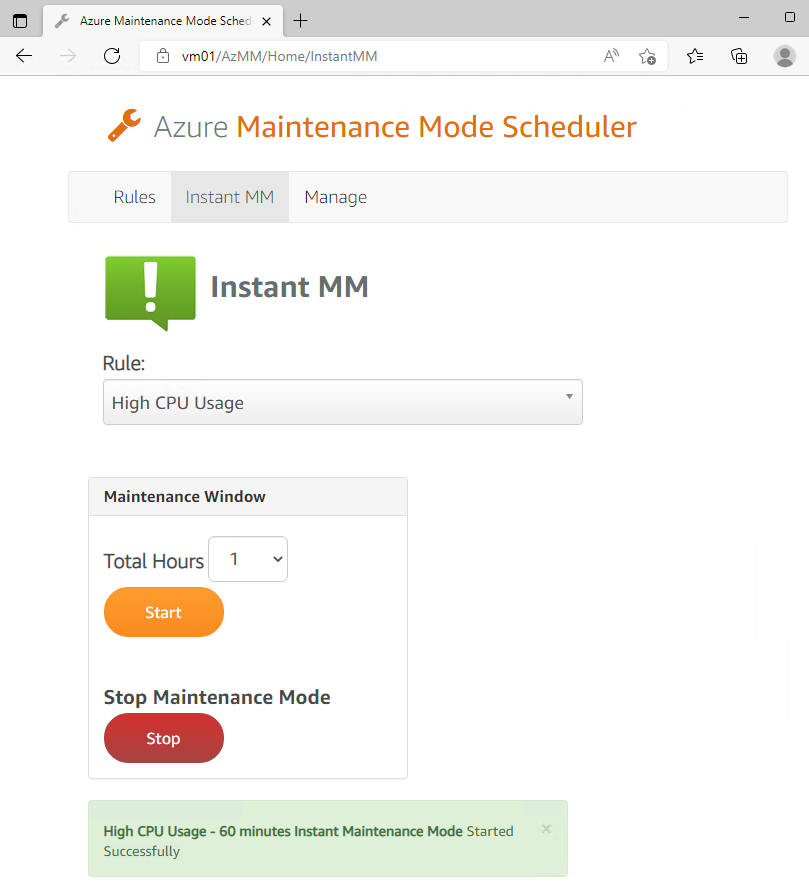
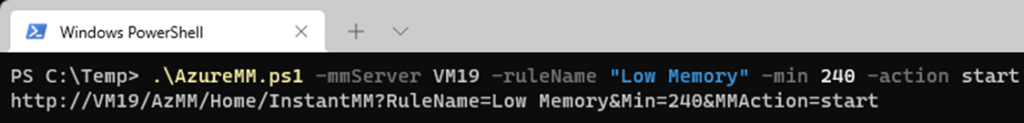
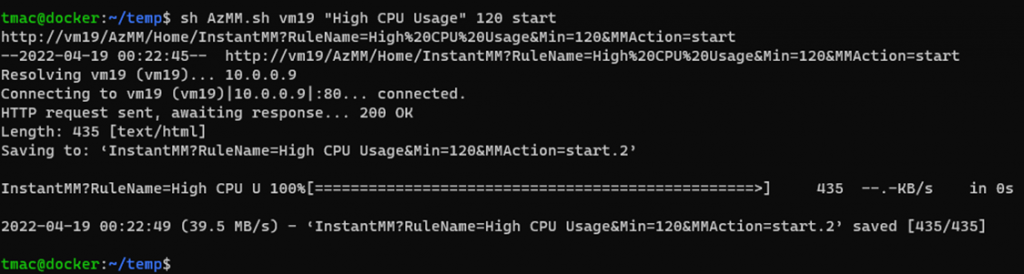
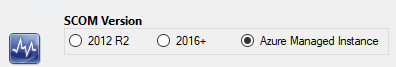
- Azure SCOM Managed Instances Support – Expanding our horizon, version 2.1 introduces full support for Azure SCOM Managed Instances. This feature allows users to seamlessly integrate their Azure-managed environments with the SCOM Maintenance Mode Scheduler, providing a unified maintenance management solution across cloud and on-premises infrastructures. Now, managing maintenance windows for Azure SCOM Managed Instances is as effortless as for your on-premises servers.
- Speed Enhancements – We understand that time is of the essence. That’s why we’ve optimized our website to load faster, providing you with a swift and responsive experience. Whether you’re scheduling maintenance, viewing upcoming windows, or accessing reports, you’ll notice a significant improvement in performance.
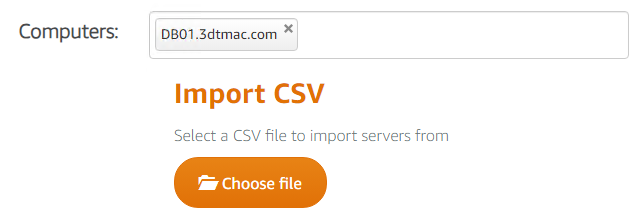
- CSV Import Improvements – Importing your server list has never been easier. With version 2.1, the CSV import functionality has been enhanced for greater flexibility. You no longer need to format your list strictly as a true CSV file. Now, you can import a straightforward list of computers, similar to the functionality available in the SCOM 2012 Maintenance Mode Scheduler. This improvement streamlines the process, saving you time and effort when managing large numbers of servers.
- Bug Fixes – We’re committed to providing a reliable and bug-free experience. In version 2.1, we’ve addressed several minor bugs, further stabilizing the application and enhancing its overall performance. These fixes are part of our ongoing effort to ensure the SCOM Maintenance Mode Scheduler meets your needs and exceeds your expectations.
Getting Started with 2.1
Upgrading to version 2.1 is straightforward and we strongly encourage all our users to update to take advantage of these new features and improvements. Visit our website for more details on the upgrade process and to download the latest version.
We’re excited to see how these new features will empower your maintenance management processes. As always, we value your feedback and are here to support you. Should you have any questions or need assistance, please don’t hesitate to reach out.
Thank you for choosing SCOM Maintenance Mode Scheduler. Here’s to making maintenance management smoother and more efficient than ever!